I have started to hedge my investments by selling Bumitama Agri to park into the “risk-free yielding” Singapore Saving Bonds (SSB) and getting some exposure to gold.
The thought of hedging came as well after Wall Street reached its longest bull run history. Despite on-going positive GDP growths, unknowns can be dug out anytime and public investors like us will likely be caught off guard. Unless one can be confident that such warnings will be revealed to them in their life or profession before things happen, the overall risk is not really worth it.
The current question in our minds during volatile times must be: should we sell all our investments now and take on lesser pain? (rather than greater pain of major corrections) While there is nothing wrong to do so even at a minor loss, it is not exactly what many will define as “long-term investing”.
Instead of selling, we can turn to hedging. Hedging can come in many forms but it is a double-edge sword. It can either buffer our losses or amplify our pain through deepened losses / opportunity costs (eg. using SSB which has zero price appreciation as compared to stocks).
I am looking at the following hedges:
Gold
Although most gold companies or funds do not pay dividends, it is an obvious hedge tool to many.
Copper is the Boon or Boom measure. Gold is the Doom measure. When it is all gloomy and doom, gold prices will move in the opposite direction of the general market.
Some gold ETFs available are:
-GLD US$ (SGX: O87)
-SPDR Gold Shares (NYSEArca: GLD)
Dividend Paying Companies
During down times, dividends are not only bonuses given to us for staying vested.
At the last resort, we can sacrifice our investments using the dividends already realized.
As an example, I am currently losing $500 on each 1000 shares of Singtel.
Till date, I have already received more than $500 worth of dividends from my whole Singtel investment.
If there is really the need to sell partially now, it is a use of realized dividends as a sacrifice.
Another option is to invest in dividend paying companies with some gold exposure. This is hedging in one investment in itself. Some mining companies are:
-OZ Minerals Limited (ASX: OZL)
-Glencore PLC (LON: GLEN)
Pharma or defensive stocks are also "hedges". When the general market is in a correction, we can tell how defensive the pharma companies are from their downside deterrence.
Singapore Saving Bonds (SSB)
For risk-free products, we can turn to the popular SSB which rewards us interest every year at “no risks” and with no price fluctuations. I have signed up for October’18 SSB with an average of 2.42% annual interest over the span of 10 years. At this rate, it is higher than most interest yielding deposits out there without the obligation to perform any transactions. The money parked in SSB will be deployed during negative times when the stock market becomes a better alternative.
While tariffs are implemented on China, there has been increased volume of shipments diverted to other ports such as Canada before shipping them to USA to evade them. UK may resort to voting for Brexit. Continual rising interest rates by the Feds. I am not sure if any the events ever reported in the news or something hidden from us will spark the next recession.
Showing posts with label Market Analysis. Show all posts
Showing posts with label Market Analysis. Show all posts
14 September, 2018
20 May, 2018
Overview of Current Holdings
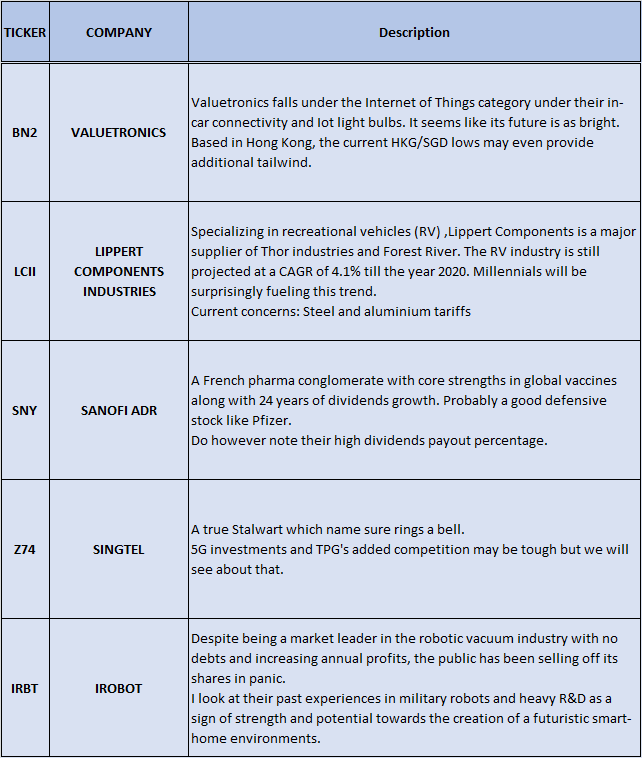
At last, I got to rebalance and fixate my portfolio to an extent and the current "uncertain" period was actually in favor of it. This revamp is in hope of minimizing on transaction costs (the Bane of investing) through the constant in and out. Let's just say that it is time to put money to work by itself than the approach of having endless portfolio revamps.
Below is a brief overview of the companies in my portfolio, with an overall and average estimated 3.16% of annual dividends after tax. Deeper analysis will be shared in the next few posts for those who are interested. Cheers.


Disclaimer:
Writings made in this blog are based on opinions and findings. The writer/author of this blog is not liable on any liabilities or losses that arises from the contents of this blog
Information shared in this blog does not guarantee completeness or accuracy.
Subjects, demographics, currencies, shares or companies mentioned in this blog does not indicate as investment recommendations but solely for discussion and sharing purposes.
Below is a brief overview of the companies in my portfolio, with an overall and average estimated 3.16% of annual dividends after tax. Deeper analysis will be shared in the next few posts for those who are interested. Cheers.

Disclaimer:
Writings made in this blog are based on opinions and findings. The writer/author of this blog is not liable on any liabilities or losses that arises from the contents of this blog
Information shared in this blog does not guarantee completeness or accuracy.
Subjects, demographics, currencies, shares or companies mentioned in this blog does not indicate as investment recommendations but solely for discussion and sharing purposes.
01 April, 2018
Thoughts on Takeover news
Takeover news can be both favorable and unfavorable, depending if the company is the one issuing the offer or the one receiving the offer. The amount offered or rumored to be transacted plays another part. So this is the logic: when company A pays a premium buying company B, share prices of company B will roar upwards while company A’s shares may plunge (due to the ridiculous offer) or surge (due to it being a great acquisition).
After Broadcom (AVGO) was recently disallowed on its attempt to take over Qualcomm (QCOM), Qualcomm’s share prices tumbled immediately through the public’s disappointment. Then again, Broadcom must have seen something in Qualcomm to be interested. Broadcom may not be able to buy Qualcomm but there is nothing stopping us investors?
Relating to a recent event, Shire (SHP) has been taken negatively by investors due to the high premium it paid taking over Baxalta in 2016. Despite diligently reducing their debts ever since, its share prices have been dropping from its all-time high. It is now a cheap stock which revenue is growing healthily, at a current low P/E and low P/BV ratio. Its share price is also way below its industry index. Speculations were that Shire may be a next takeover target and few fund managers have also been actively adding Shire to their portfolio since last year.
Then just last week, look what happened when Takeda (TKPYY) announced its consideration to take over Shire at $50 billion.

The offer was stretched, and in fact it was above Takeda’s own capitalization of $42 billion. It was quoted to be “Japanese company’s biggest takeover ever” if it was ever successful.
While Shire’s investors cheered, Takeda’s investors were disappointed on the premium “proposed”.
You may feel free to find out more here.
After Broadcom (AVGO) was recently disallowed on its attempt to take over Qualcomm (QCOM), Qualcomm’s share prices tumbled immediately through the public’s disappointment. Then again, Broadcom must have seen something in Qualcomm to be interested. Broadcom may not be able to buy Qualcomm but there is nothing stopping us investors?
Relating to a recent event, Shire (SHP) has been taken negatively by investors due to the high premium it paid taking over Baxalta in 2016. Despite diligently reducing their debts ever since, its share prices have been dropping from its all-time high. It is now a cheap stock which revenue is growing healthily, at a current low P/E and low P/BV ratio. Its share price is also way below its industry index. Speculations were that Shire may be a next takeover target and few fund managers have also been actively adding Shire to their portfolio since last year.
Then just last week, look what happened when Takeda (TKPYY) announced its consideration to take over Shire at $50 billion.

The offer was stretched, and in fact it was above Takeda’s own capitalization of $42 billion. It was quoted to be “Japanese company’s biggest takeover ever” if it was ever successful.
While Shire’s investors cheered, Takeda’s investors were disappointed on the premium “proposed”.
You may feel free to find out more here.
04 December, 2016
Stock Picking using SGX's Stock Facts
The Straits Times Index has
been green for 8 consecutive working days and finally came flat on last Friday,
2nd December. Most share prices are getting "expensive" again and
probably pricing in more effects of OPEC’s oil production cut and the much anticipated
Fed's rate hike. Personally, I feel it is more of a hold or sell period now
unless value is found.
With reference to Benjamin
Graham’s The Intelligent Investor, Mr. Market is always there to make business
with us. He visits us on different days, influencing and offering us a price to
buy or sell. That price may be too high or too low but Mr. Market does not
care. As long as you are willing to make the trade, he is willing to take your
offer. This was found in Chapter 8 of The Intelligent Investor, which Warren
Buffett had commented that it would probably be the most important chapter which
he read in his life. Mr. Market is a
distraction and usually encourages us to look short term and make rash
decisions. As the book mentioned, Mr. Market can be irrational in his prices
and “is there to serve you, not to guide you”. It is up to your behavior to resist
his persuasions.
Given that there are so
many stock options in the market, some may find it hard to filter out the noise
despite knowing what fundamentals to apply. One method which I came along when
I just started investing is the use of the SGX’s platform. Under “Company
Information” > “Stock Facts”, you are allowed to filter the stocks according
to the set criteria which you input as shown in below image. This may be useful
for new investors.
There are many different
criteria to play with, accordingly to your own
liking and risk appetite - Industry,
Market Data, Valuations and
Financials As an illustration and based on my preference, I have filtered
the criteria as per below. Please note that this does not mean any filtered results
provide a definite list of potential stocks. After all, not all data can be
proven accurate unless you do more research into each company.
 |
| Criteria Filtering |
My Filters:
1. Total
Market Cap: This relatively shows
the financial strength of the company as a whole. I have filtered to view any
firms with more than $50 million capitalization.
2. Price/Earnings
Ratio (P/E): This is just a
comparison of share prices to the companies’ earnings. Any P/E above 15 is a
warning sign so my preferred P/E is around 10.
3. Dividends
Yield: As an investor who
prefers growth over dividends, I have selected a yield of 5 or less. Higher
yield usually means more risks while lower yield can at times indicate
potential in growth. It is very subjective.
4. 3-Year
Revenue Growth: This indicator focuses
on the revenue growth of the company’s most recent 3 years records. Ideally,
6-7% of annual earnings growth is optimal. Too fast in growth can lead a
company to “burn out”. In other words, slow and steady wins the race.
5. Debt/Equity
Ratio: To my liking and safety
margin, I have inserted about 60% on this ratio. This also can mean with every $60
of debts, the companies will have $100 of equity (total assets-total liabilities)
to rely on.
Other useful criteria to
be considered:
1.
Price/Book Value (P/BV): Basically, this is the share price as compared
to its book value. Any value more than 1 generally means the stock’s current
price is overvalued while those with less than 1 are undervalued.
2.
Net Profit Margin: This is a percentage of profit after taxes as
compared to the revenue of the past fiscal year.
With that, you were be given a list of stocks which falls into all the criteria you have inserted and that will be where you can start to "shop" for value. However, this might only be the first and one of many steps of the stock picking analysis. We still have to look beyond its ratios and quantitative measures. It is the qualitative measures that are difficult to identify in terms of competitive advantage, future potential to grow, resistance to competition, resilience to market breakdown, product and business nature, write off risks, industrial prospects and many more. Addition to this, we will have to get back to the share price and ask ourselves if the current price is of value to buy or to sell. If you are able to value a company at $1 per share and it is only selling for 80 cents per share after your good analysis, then it is probably a potential buy. It is about striking the right move on the right place at the right time.
05 November, 2016
The State of Air and Sea
Recently, the downfall of Hanjin container line has sent shock waves across the world. Low fuel prices were supposed to boost shipment traffics but export volume for both air and sea shipments were lackluster. Better known as Bunker charges, the crude oil surcharge used to take a significant portion of sea freight costs. Now that bunker is cheap with a abundance of ships and high competition among container lines, it proved to have made the container liner industry worse than better. On the contrary, freight forwarders are faring better as they take advantage of the cheap freight, booking spaces and fuel prices while sucking the container liners dry.
Airfreight
Shown above is the 10 year charting of crude oil prices as a reference. It is a known tale that oil prices have hit lower than the lows of the 2008 recession and fuel consumers were supposed to enjoy a great deal of discount. However, airfreight volume growth in the year of 2016 were forecasted to remain flat with exports from Europe and Middle East expected to grow further while Transpacific trades to fall as compared to year 2015. Below are the estimates in terms of growth in airfreight volume. (Year-to-date figures)
Sea Freight
On the other end, we have the below ocean freight forecast on growth for both 2016 and 2017. The larger arrows represent larger amount of TEUs (Twenty Foot Equivalent Unit) movements. The year 2016 will only see about 1.7% in growth, after factoring in current economic uncertainties and poor global outlook. Due to the strong US currency, US exports were likely to remain flat.
Export and import figures represents a sign of demand and supply in global trades between countries (we should also consider the existence of domestic trades). Believing that each country will lack certain raw materials or products, each nation will need to import goods in order to feed the local demand. It is pretty clear that trades have slowed down despite cheap fuel prices and sea freight rates. With the lackluster global demand, one shall now ponder how organizations will be affected globally. Management world-wide may start to take cost cutting approaches, leading to an increase in retrenchments and unemployment while governments may be forced to consider fiscal policies and market interventions. Will your holdings be affected?
 |
| 10 Years Chart |
Shown above is the 10 year charting of crude oil prices as a reference. It is a known tale that oil prices have hit lower than the lows of the 2008 recession and fuel consumers were supposed to enjoy a great deal of discount. However, airfreight volume growth in the year of 2016 were forecasted to remain flat with exports from Europe and Middle East expected to grow further while Transpacific trades to fall as compared to year 2015. Below are the estimates in terms of growth in airfreight volume. (Year-to-date figures)
Airfreight Volumes
Asia +1.0%
Americas -3.3%
Europe +1.8%
Middle East +4.5%
Africa +0.7%
Sea Freight
On the other end, we have the below ocean freight forecast on growth for both 2016 and 2017. The larger arrows represent larger amount of TEUs (Twenty Foot Equivalent Unit) movements. The year 2016 will only see about 1.7% in growth, after factoring in current economic uncertainties and poor global outlook. Due to the strong US currency, US exports were likely to remain flat.
 |
| Growth in Ocean Freight (% based in TEUs) |
Export and import figures represents a sign of demand and supply in global trades between countries (we should also consider the existence of domestic trades). Believing that each country will lack certain raw materials or products, each nation will need to import goods in order to feed the local demand. It is pretty clear that trades have slowed down despite cheap fuel prices and sea freight rates. With the lackluster global demand, one shall now ponder how organizations will be affected globally. Management world-wide may start to take cost cutting approaches, leading to an increase in retrenchments and unemployment while governments may be forced to consider fiscal policies and market interventions. Will your holdings be affected?